At a glance
The context, the business need, and what the solution changes.
Business context
Data Visualization
The need
When each signal is reviewed separately, it is harder to compare branches and understand what is driving performance. The dashboard needed to preserve the overall picture while making operational differences visible.
What the solution does
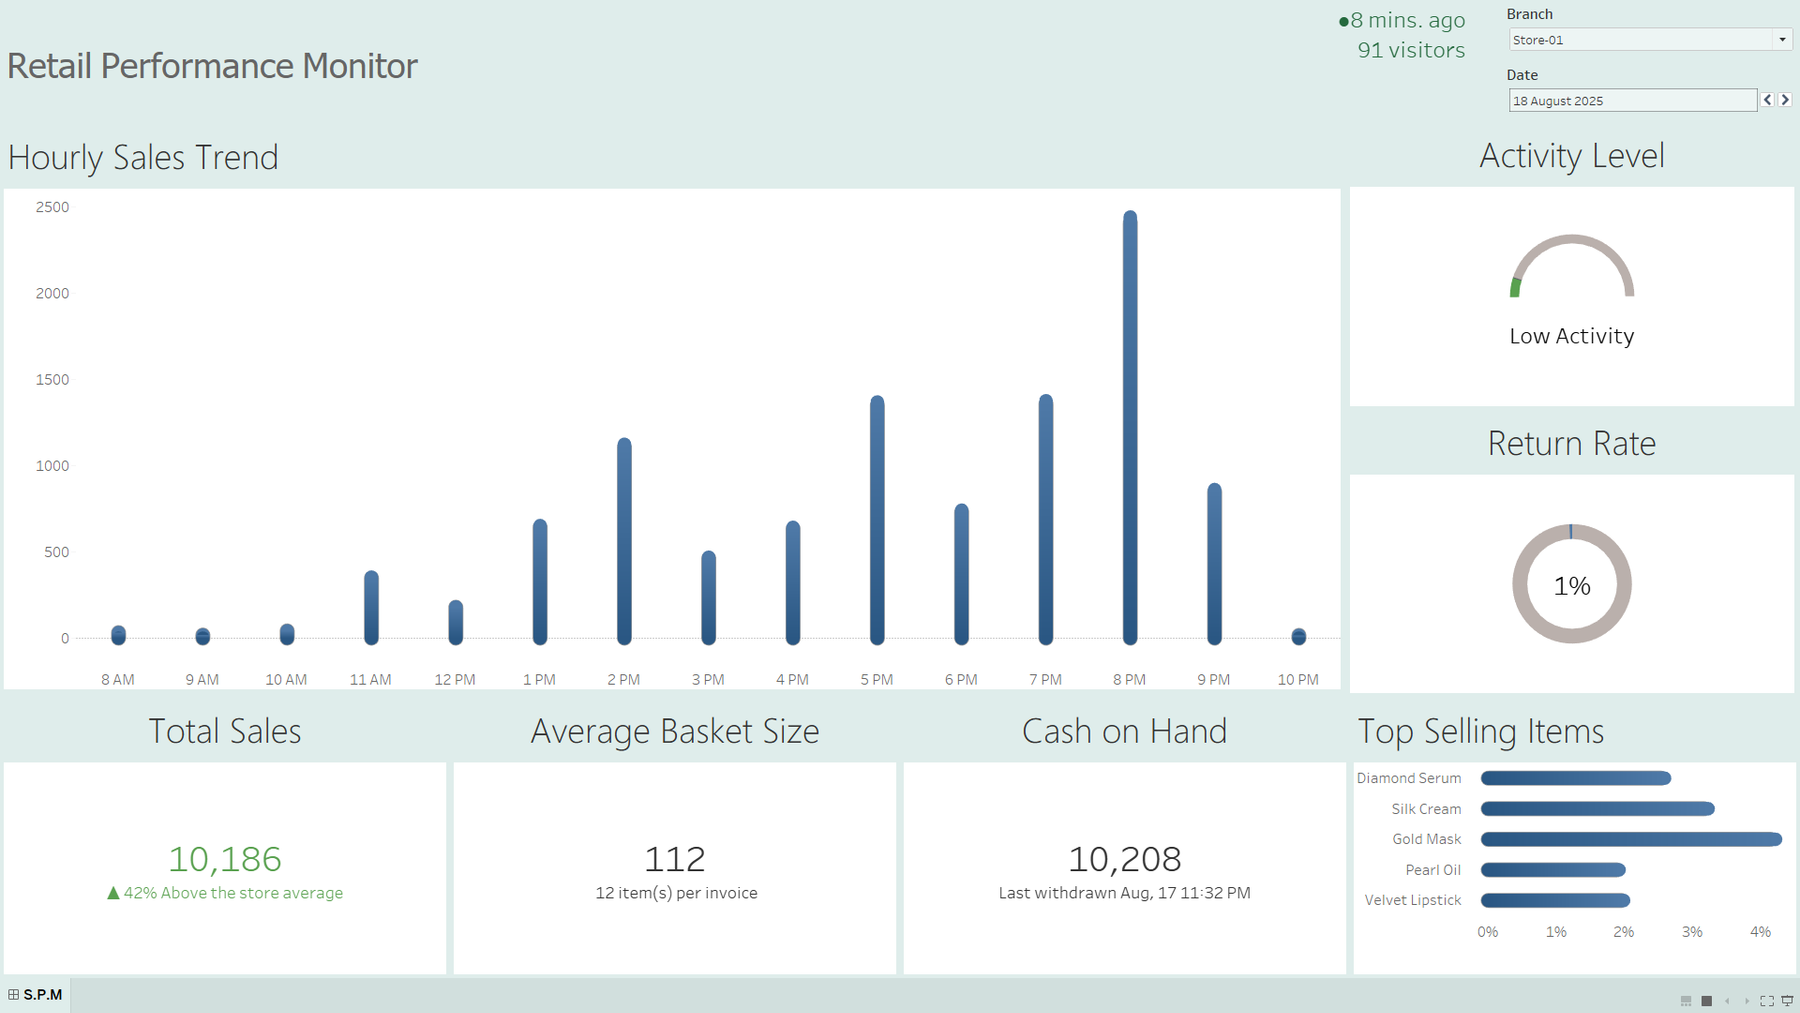
This Tableau case organizes the daily signals of multi-branch retail performance into a focused monitoring experience. It helps the reader move from a network-level view to the operating details that explain how individual stores are performing.
01
Why this needed to exist
Multi-branch retail operations generate connected signals across sales, cash movement, returns, products and store performance. The case brings those signals together so they can be reviewed as one operating picture.
When each signal is reviewed separately, it is harder to compare branches and understand what is driving performance. The dashboard needed to preserve the overall picture while making operational differences visible.
02
How the solution works
The analytical structure follows the questions a retail operator would ask: how the network is performing, where branch differences appear, how cash activity and returns relate to sales, and which items require attention.
A Tableau dashboard was designed around branch sales, cash activity, returns, top items and store KPIs, giving each layer a clear place in the wider performance story.
Supporting technologies
- Tableau
03
What changed
The approved Maven case provides the public project record and visual dashboard evidence for the retail analysis.
The practical value is a clearer way to monitor the retail network, compare store performance and investigate the operating signals behind the headline view. No quantified business outcome is claimed.