At a glance
The context, the business need, and what the solution changes.
Business context
Data Visualization
The need
Traditional AR reporting often treats the ledger balance as the complete receivables position.
That becomes misleading when collections include uncleared cheques, aging depends on due dates, cheque status changes over time and the same customer position must be understood across different accounts and business dimensions.
The core problem was therefore not building another receivables dashboard. It was creating a consistent financial model for exposure, collections and cheque lifecycle so every KPI could be traced back to the same business logic.
What the solution does
An end-to-end receivables intelligence solution built to give finance and management a reliable picture of what customers owe, what is overdue, what has been collected and where the remaining exposure sits.
The solution combines SQL Server, SSIS and governed financial logic with interactive Tableau and Power BI experiences, allowing users to move from the overall AR position into the customers, regions, accounts and other dimensions driving it.
01
Why this needed to exist
Receivables data existed across accounting transactions, customer records, cheque movements, account structures and payment activity, but the management questions crossed all of them.
A customer balance alone could not explain whether an amount was overdue, already received as a cheque, still under collection, cleared, bounced or sitting as a credit. Management needed one analytical view that could reconstruct that position for a selected period and explain the movement behind it.
Traditional AR reporting often treats the ledger balance as the complete receivables position.
That becomes misleading when collections include uncleared cheques, aging depends on due dates, cheque status changes over time and the same customer position must be understood across different accounts and business dimensions.
The core problem was therefore not building another receivables dashboard. It was creating a consistent financial model for exposure, collections and cheque lifecycle so every KPI could be traced back to the same business logic.
02
How the solution works
I treated the AR position as a financial state that had to be reconstructed from transaction history rather than read from a single balance field.
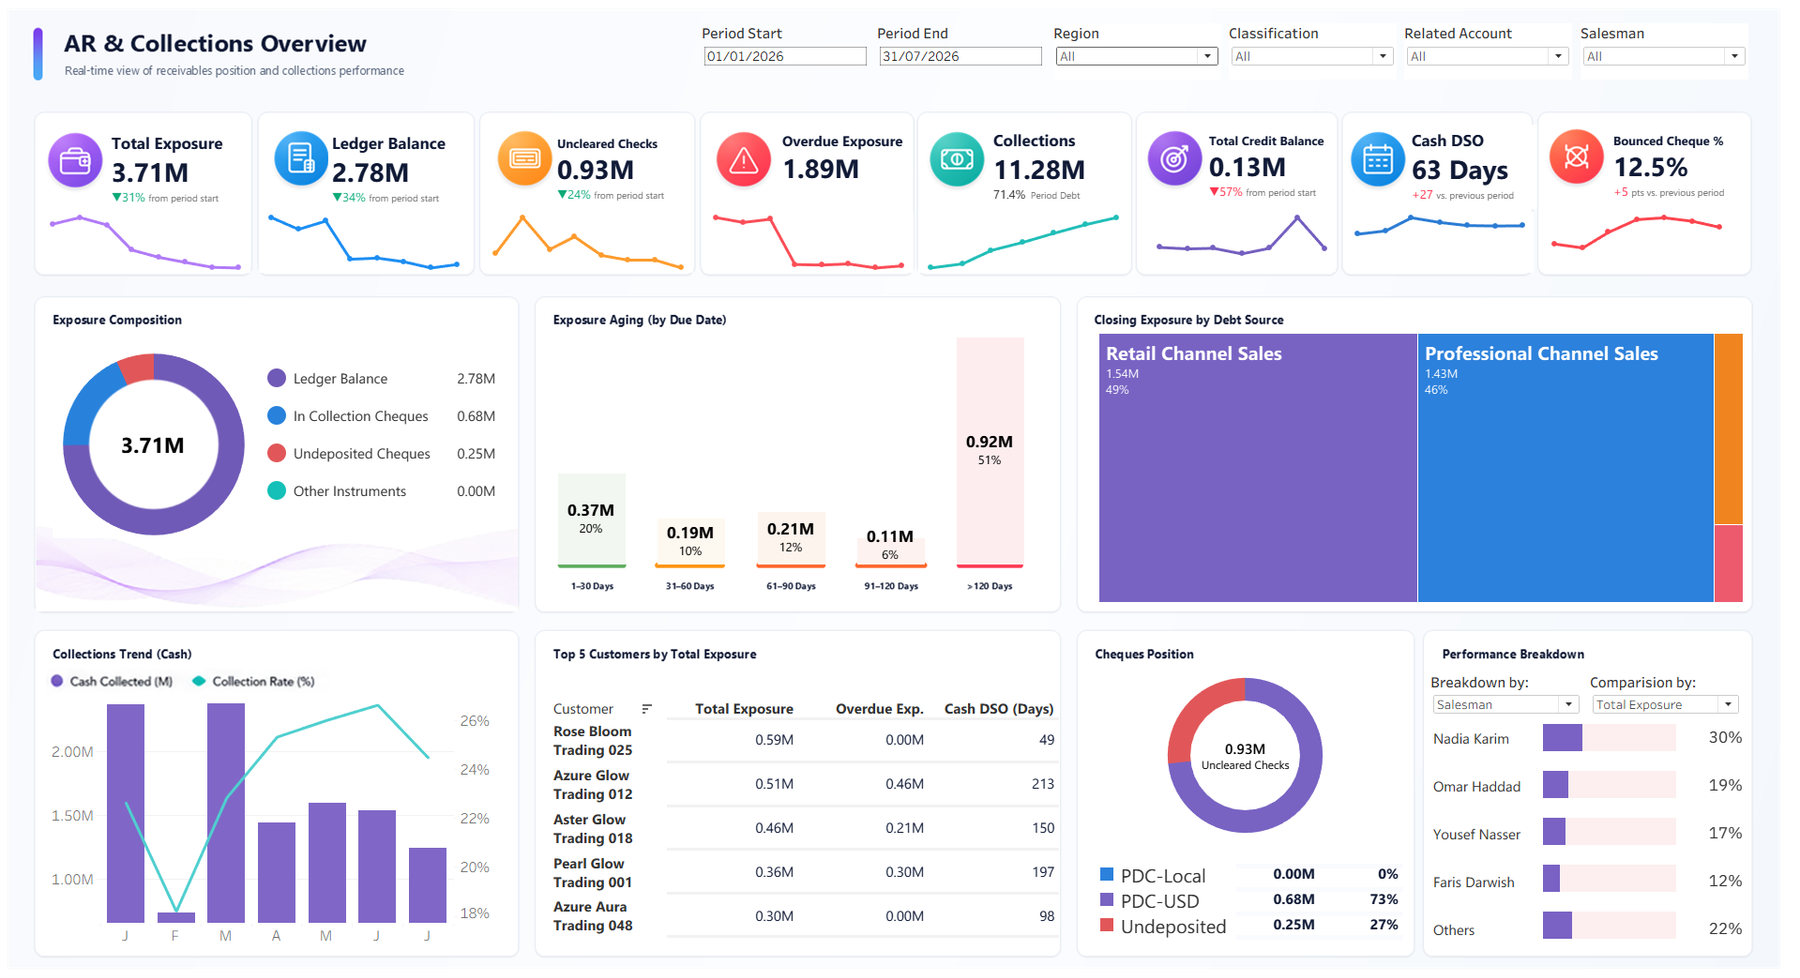
The model separates ledger exposure from uncleared instruments, evaluates aging by due date, follows cheque movement through its lifecycle and keeps collections, Cash DSO, bounced cheque rate, credit balances and debt-source analysis aligned to the selected reporting period.
The analytical logic is handled before the visualization layer so Tableau and Power BI do not create separate versions of the financial truth. Where repeated calculations would be expensive, prepared analytical structures and indexed snapshots reduce the work required at dashboard runtime.
The result is one governed AR and collections model that can support different BI experiences without redefining the business logic in each one.
I built the data foundation in Microsoft SQL Server and SSIS, integrating AR transactions, customer data, cheque activity, transaction types and ledger-account structures into finance-ready analytical data.
The implementation covers historical position logic, customer exposure, due-date aging, collections, customer credit balances, Cash DSO, bounced cheque analysis, cheque lifecycle and closing exposure by debt source.
The original management experience was developed in Tableau with period, region, classification, related-account and salesperson analysis, supported by exposure composition, aging, collection trends, top-customer analysis, cheque positions and dynamic performance breakdowns.
I later delivered the same AR and collections intelligence through Power BI, demonstrating that the reporting experience can change while the underlying financial definitions remain governed and consistent.
Supporting technologies
- Microsoft SQL Server
- SQL Server Integration Services (SSIS)
- ETL
- Tableau
- Power BI
03
What changed
I built the data foundation in Microsoft SQL Server and SSIS, integrating AR transactions, customer data, cheque activity, transaction types and ledger-account structures into finance-ready analytical data.
The implementation covers historical position logic, customer exposure, due-date aging, collections, customer credit balances, Cash DSO, bounced cheque analysis, cheque lifecycle and closing exposure by debt source.
The original management experience was developed in Tableau with period, region, classification, related-account and salesperson analysis, supported by exposure composition, aging, collection trends, top-customer analysis, cheque positions and dynamic performance breakdowns.
I later delivered the same AR and collections intelligence through Power BI, demonstrating that the reporting experience can change while the underlying financial definitions remain governed and consistent.