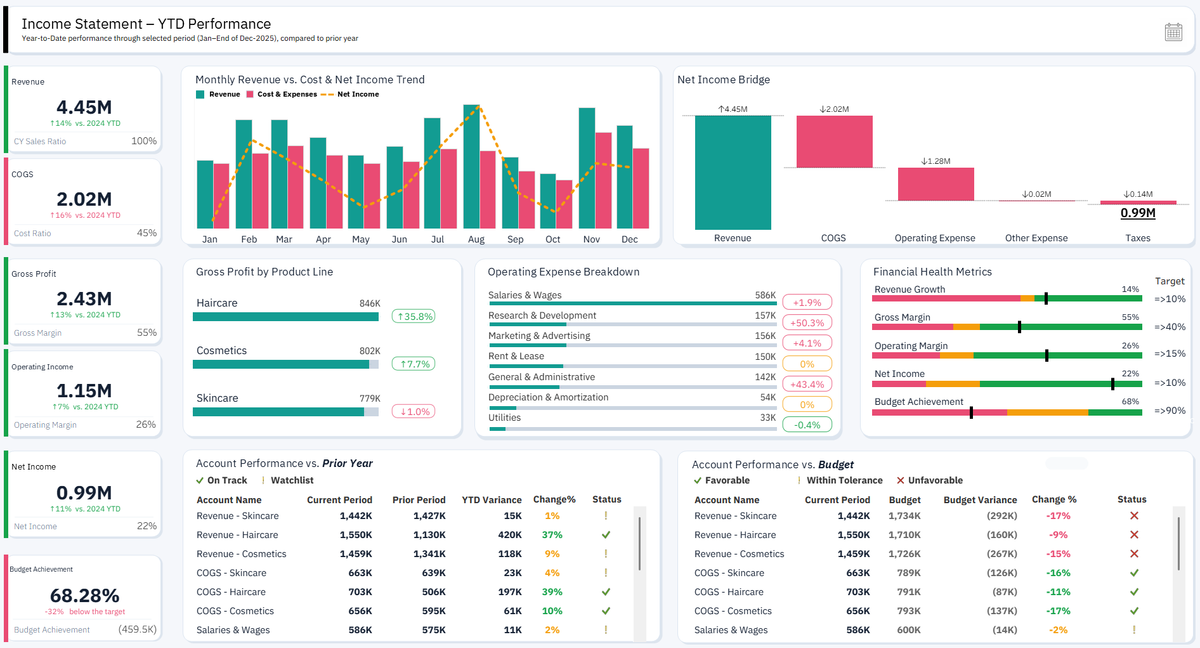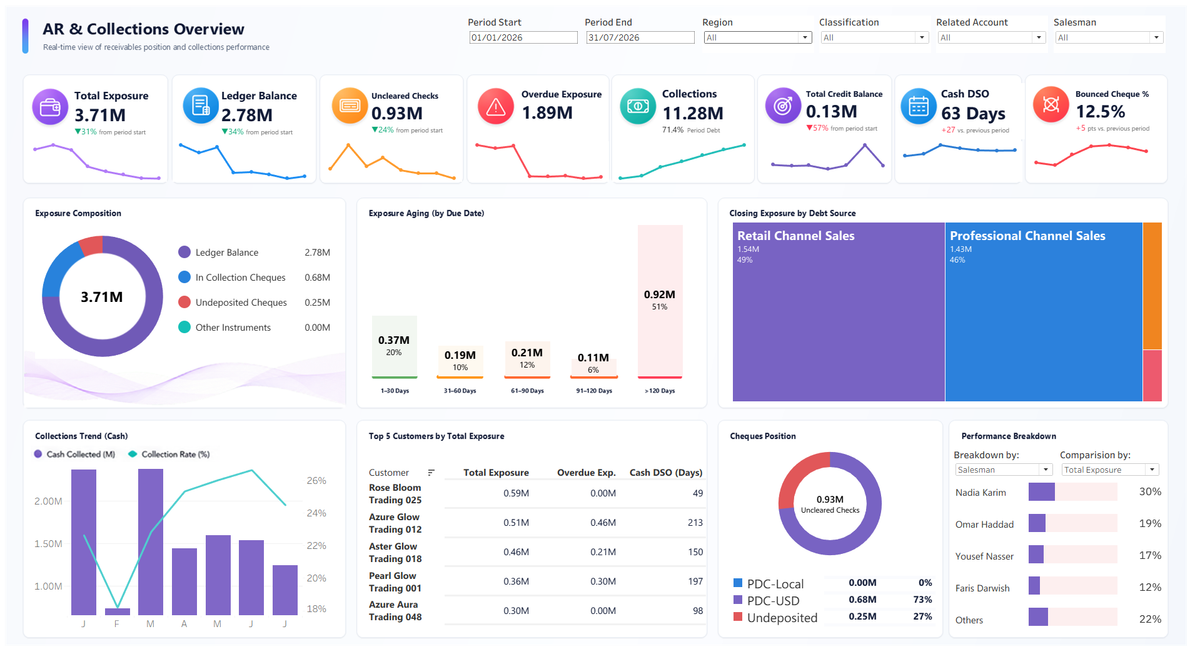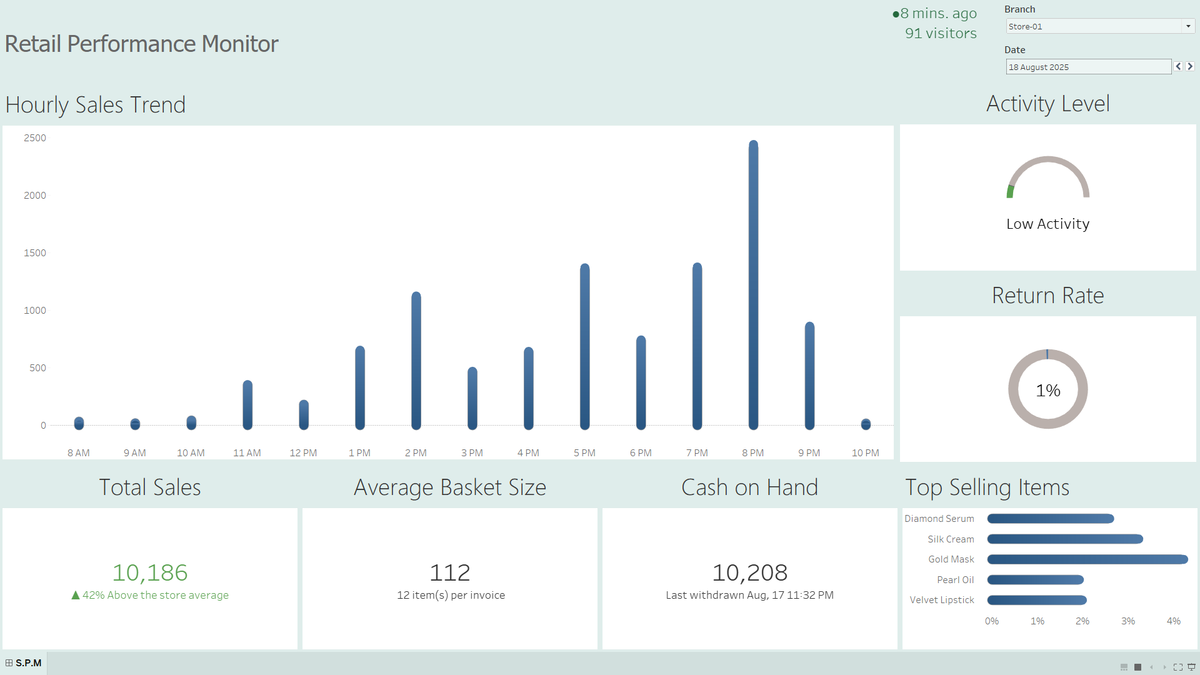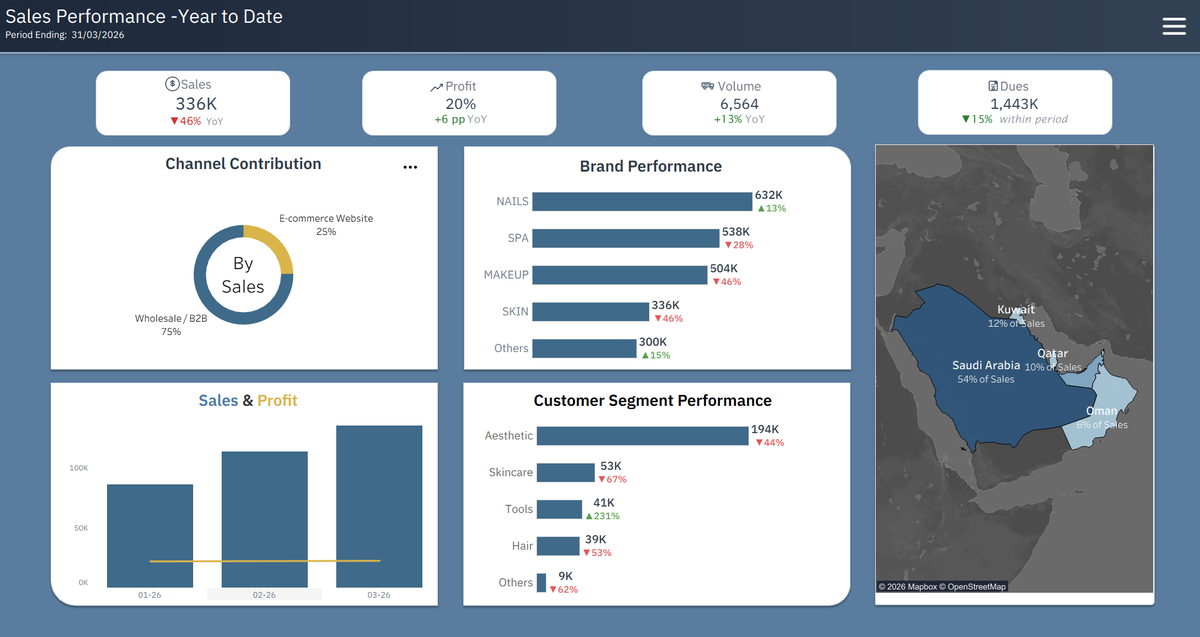
At a glance
The context, the business need, and what the solution changes.
Business context
Data Visualization
The need
A high-level total alone does not explain why sales performance changes. The dashboard needed to preserve an executive overview while supporting multi-dimensional investigation.
What the solution does
This case presents sales performance as a connected executive narrative rather than a collection of disconnected charts. Its multi-dimensional structure supports movement from an overall view into the perspectives that help explain performance.
01
Why this needed to exist
Sales leaders need a concise performance view while still being able to explore the dimensions behind the result. The case balances executive clarity with analytical depth.
A high-level total alone does not explain why sales performance changes. The dashboard needed to preserve an executive overview while supporting multi-dimensional investigation.
02
How the solution works
The design uses a layered analytical story: establish the performance picture first, then reveal the dimensions that help the reader interpret differences and patterns.
The dashboard was structured as a multi-dimensional sales analysis with an executive entry point and deeper analytical views. Specific technical details remain pending source review.
03
What changed
The approved Maven case is the public evidence source for the dashboard and its multi-dimensional sales-performance presentation.
The practical value is a clearer route from executive review to deeper performance investigation. No quantified sales improvement is claimed.