Service
Executive Dashboards and Decision Systems
Turn scattered operational and financial data into a clear view of performance, priorities and emerging risks.
Start with the problem01
When this helps
Leaders often receive reports that describe activity without showing what changed, why it matters or where action is needed. Different definitions and disconnected views make comparison slow and weaken confidence in the numbers.
02
What this can include
- 01
Decision and KPI framework
- 02
dashboard architecture
- 03
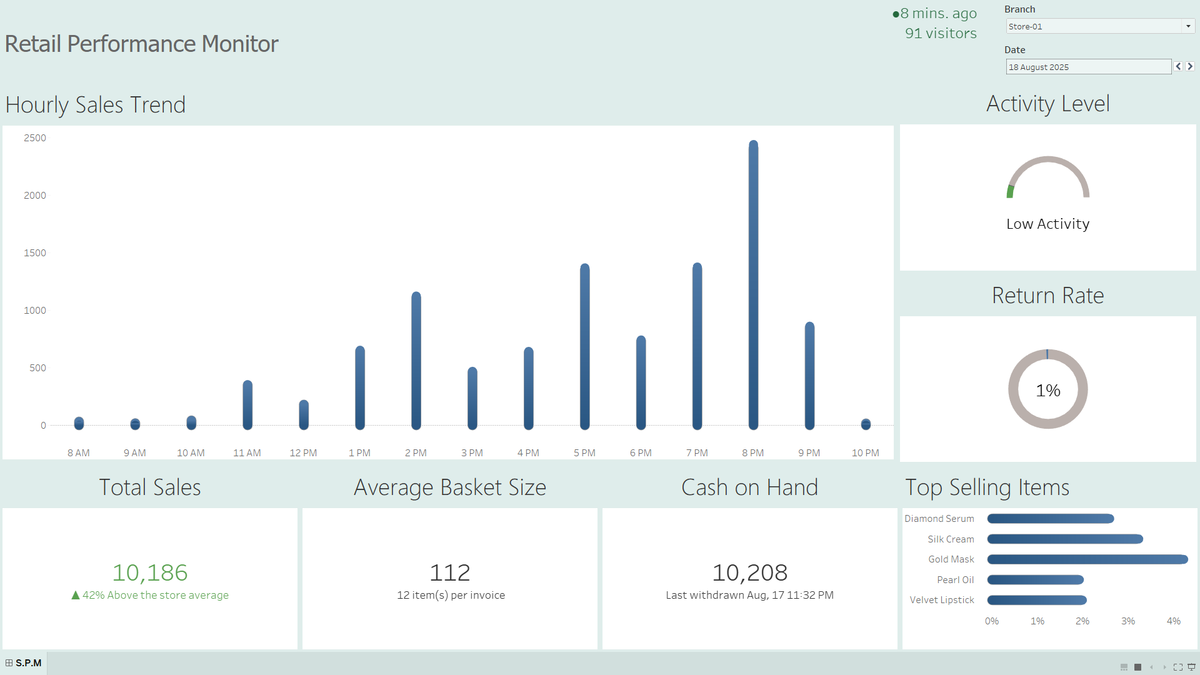
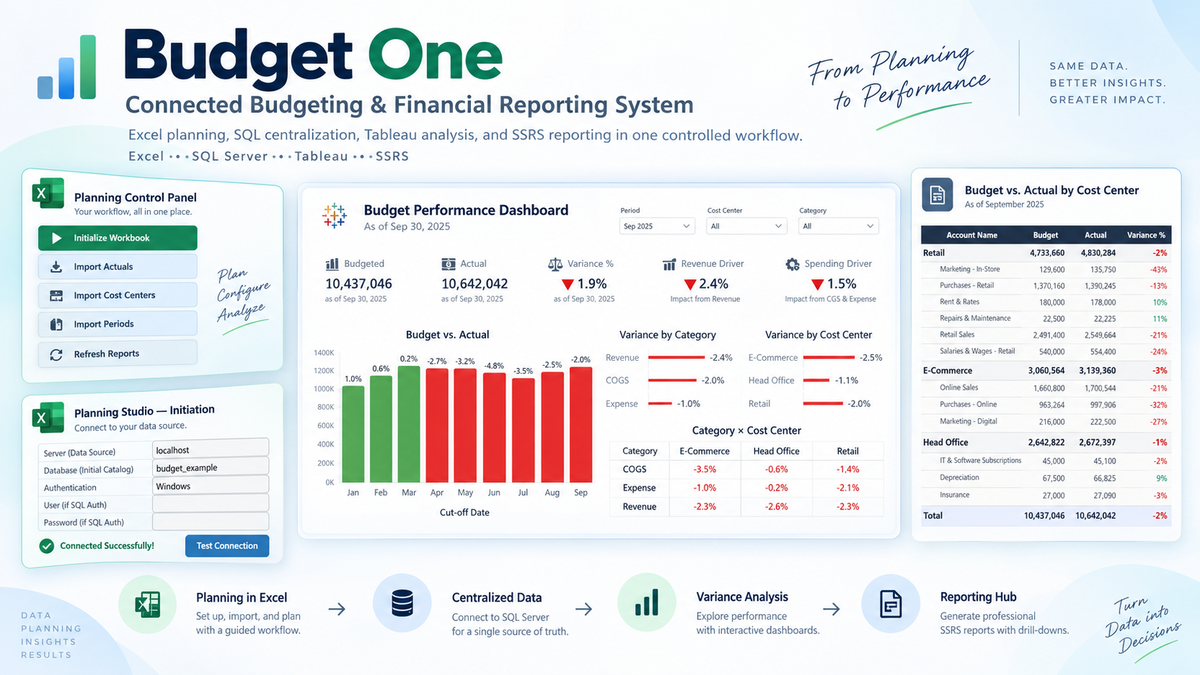
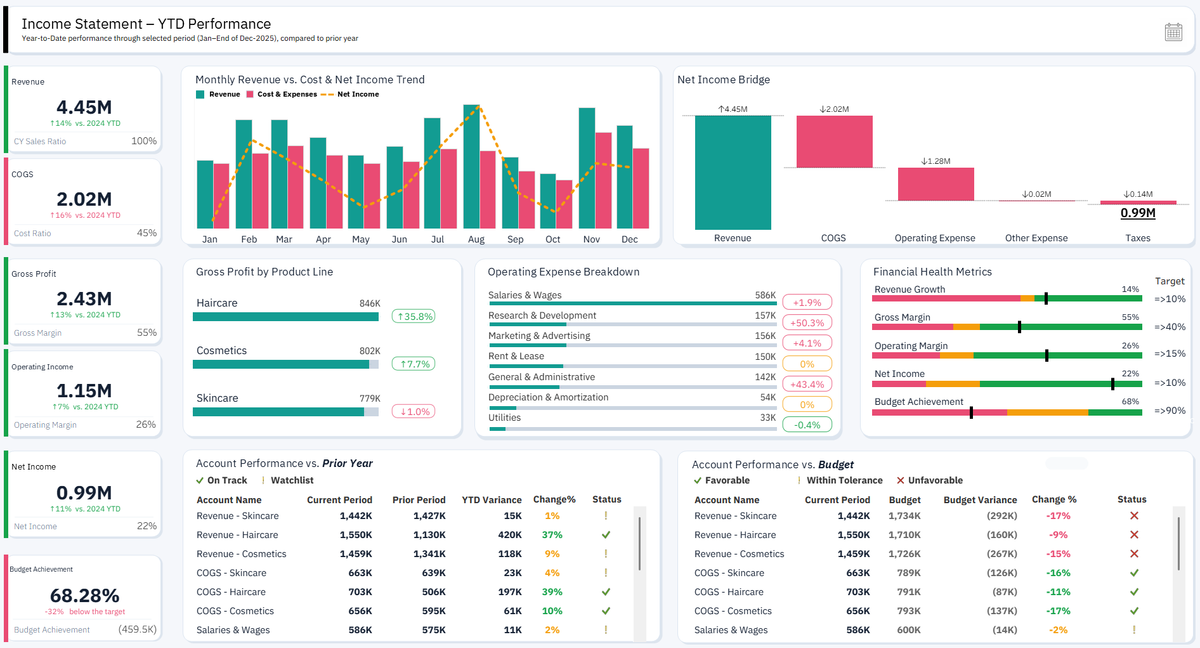
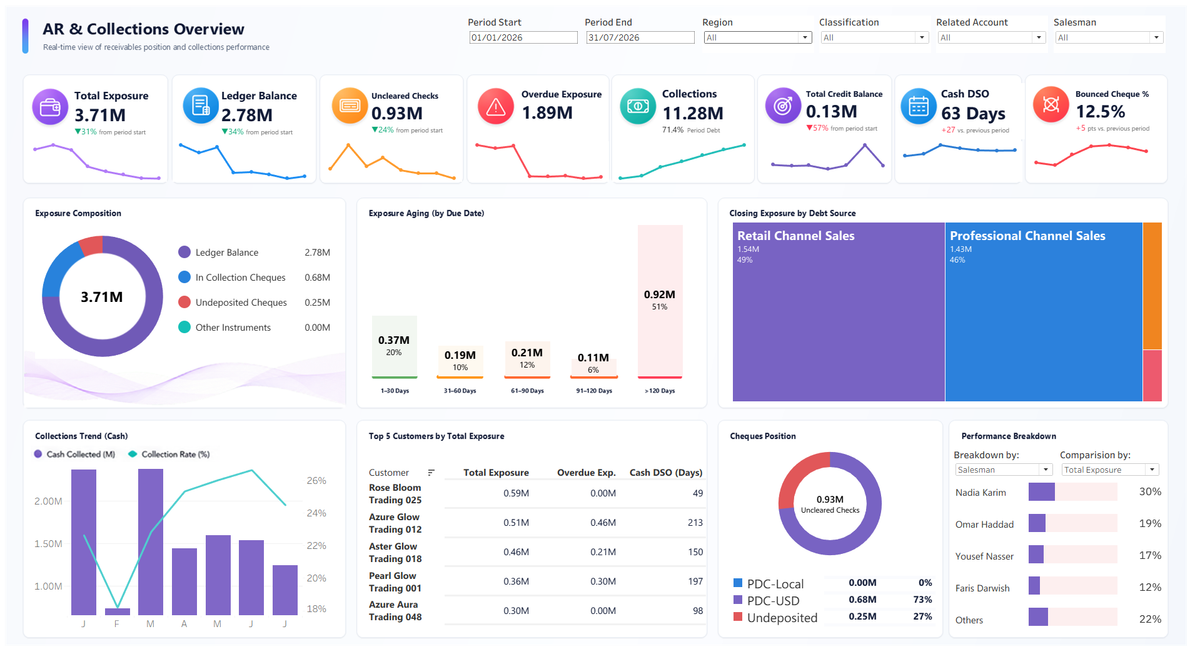
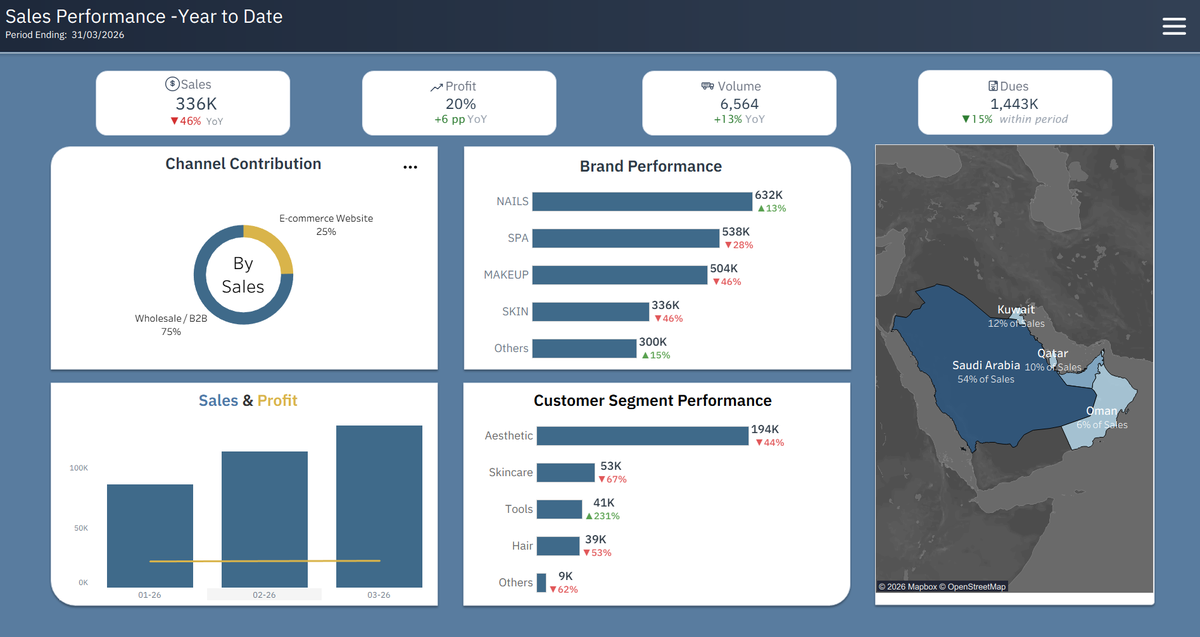
interactive executive dashboards
- 04
drill-down analysis
- 05
calculation and data-definition documentation
- 06
handover and guidance.
03
How I approach the work
Ibrahim clarifies the decisions the dashboard must support, aligns KPI definitions, shapes the analytical model, builds interactive views and refines the story so important changes and exceptions are easy to understand.
04
Practical value
A clearer and more consistent way to monitor performance, identify exceptions and discuss priorities using shared definitions.
Have a similar challenge?
Start with the problem context and the decision or output you need.