At a glance
The context, the business need, and what the solution changes.
Business context
BI & Reporting
The need
The challenge was not simply presenting more charts. Management needed to move quickly from a summary result into the evidence behind it without mixing analytical scopes or creating misleading interpretations, especially where sales activity, whole-account credit exposure, inventory availability and order coverage follow different business rules.
The application also needed to preserve data-quality boundaries. Missing evidence should remain visible as missing, modeled estimates should be identified as estimates, and operational availability should not be presented as a reservation or promise.
What the solution does
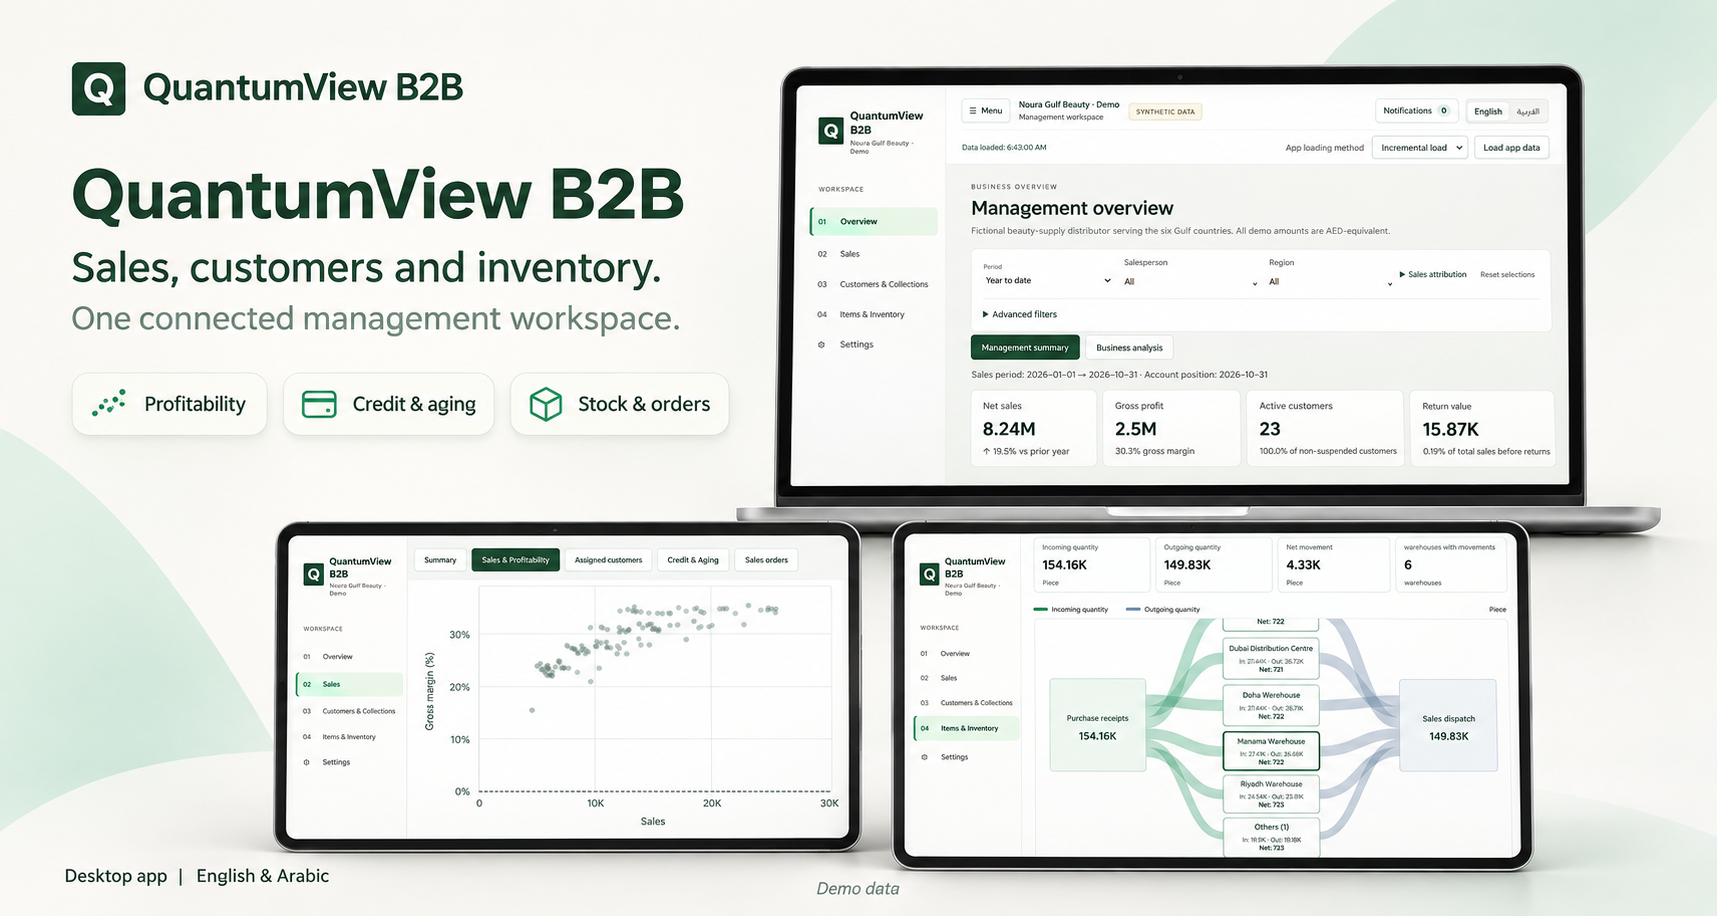
QuantumView B2B brings sales, profitability, customer accounts, credit exposure, collections, inventory, sales orders and salesperson performance into one analytical environment for distributors and trading companies. Rather than stopping at headline KPIs, it is designed to let an owner or manager move from a management signal into the supporting accounts, items, documents and operational evidence needed to understand what is happening.
01
Why this needed to exist
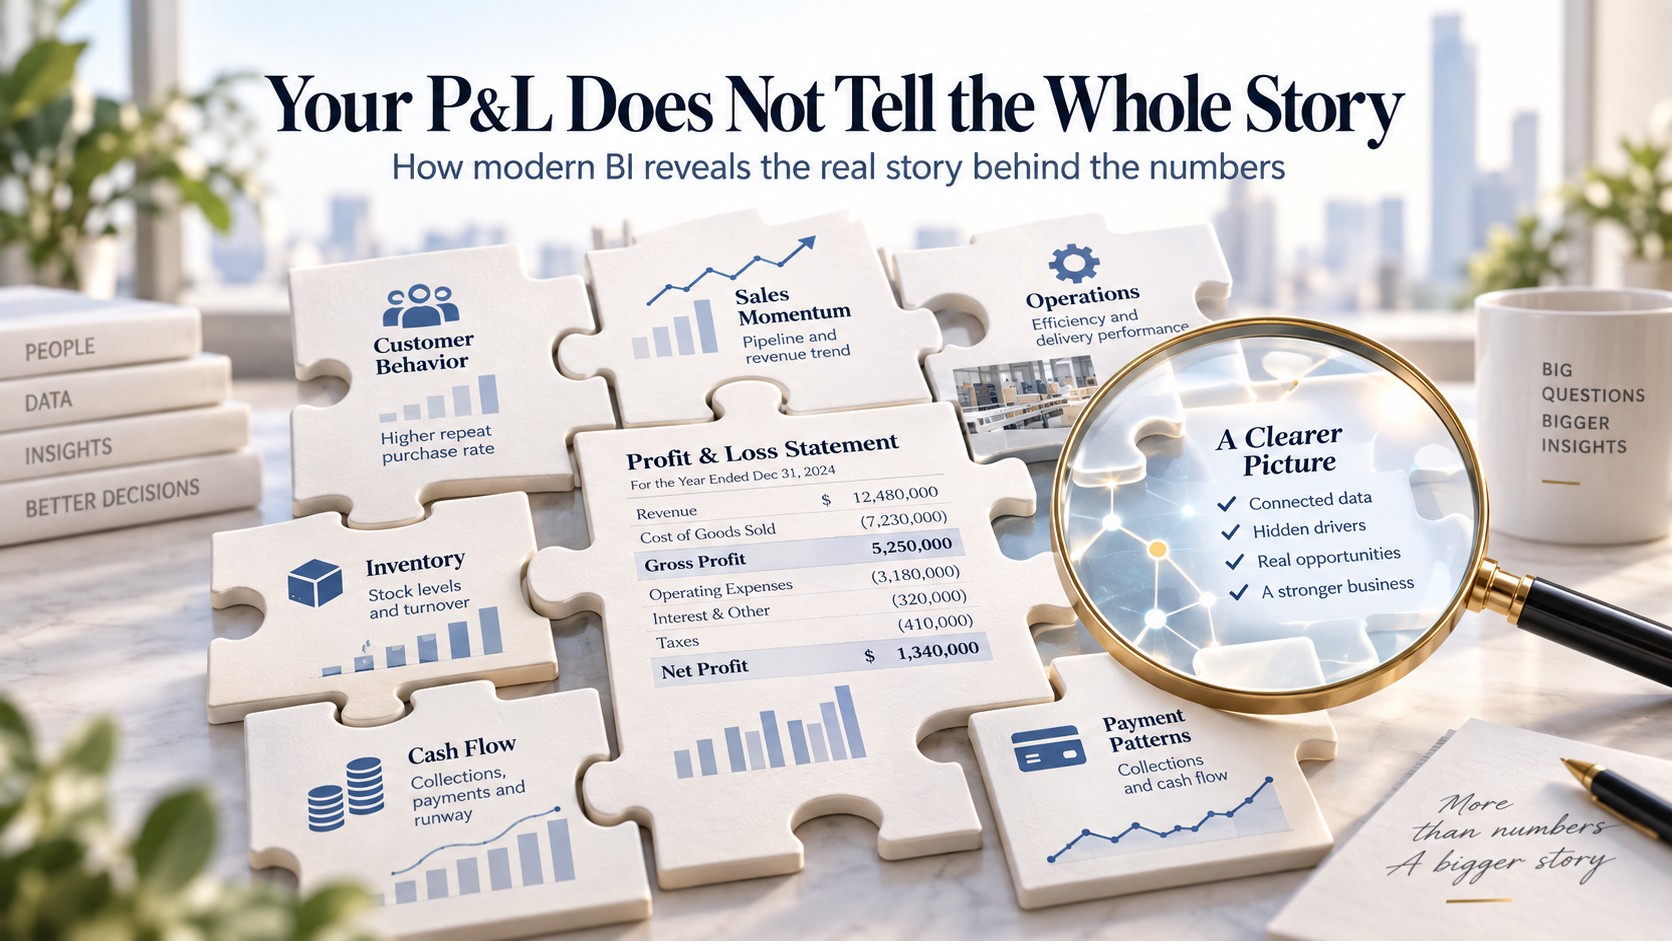
B2B distributors often have the data they need inside operational systems, yet management questions cut across sales, receivables, cheques, inventory, open orders, customer behavior and salesperson responsibility. A single result can therefore require several reports and multiple layers of investigation before the business understands what is actually driving it.
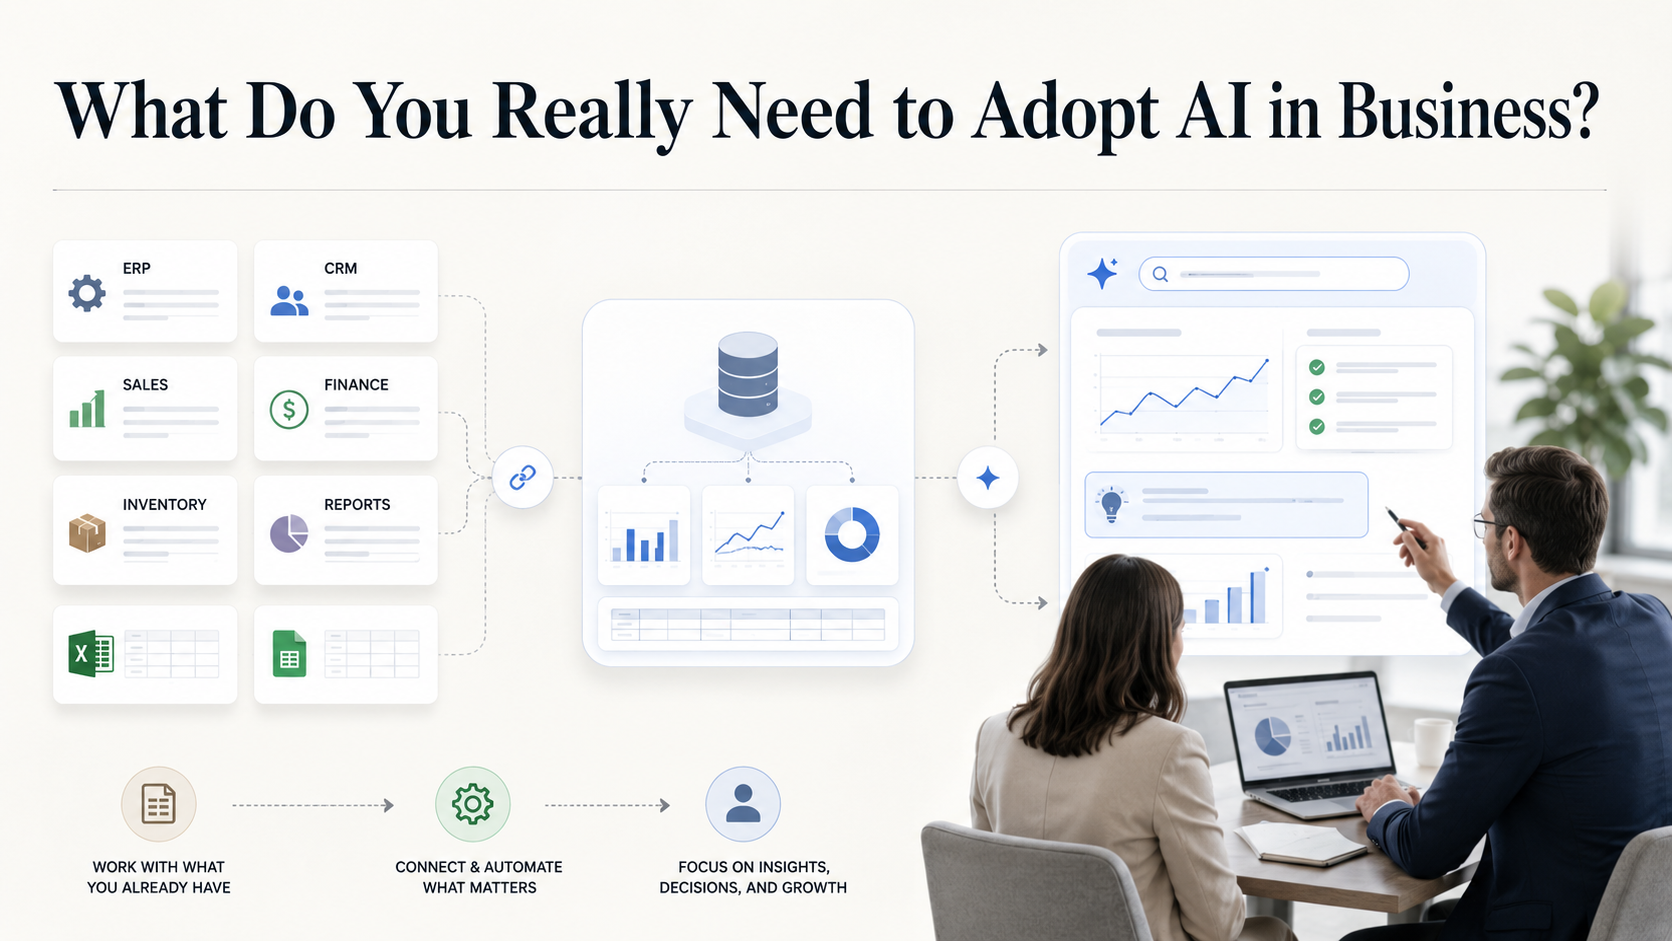
QuantumView B2B was developed as a management-focused analytical layer that brings these connected questions into one working environment while leaving operational transactions in the source business system.
The challenge was not simply presenting more charts. Management needed to move quickly from a summary result into the evidence behind it without mixing analytical scopes or creating misleading interpretations, especially where sales activity, whole-account credit exposure, inventory availability and order coverage follow different business rules.
The application also needed to preserve data-quality boundaries. Missing evidence should remain visible as missing, modeled estimates should be identified as estimates, and operational availability should not be presented as a reservation or promise.
02
How the solution works
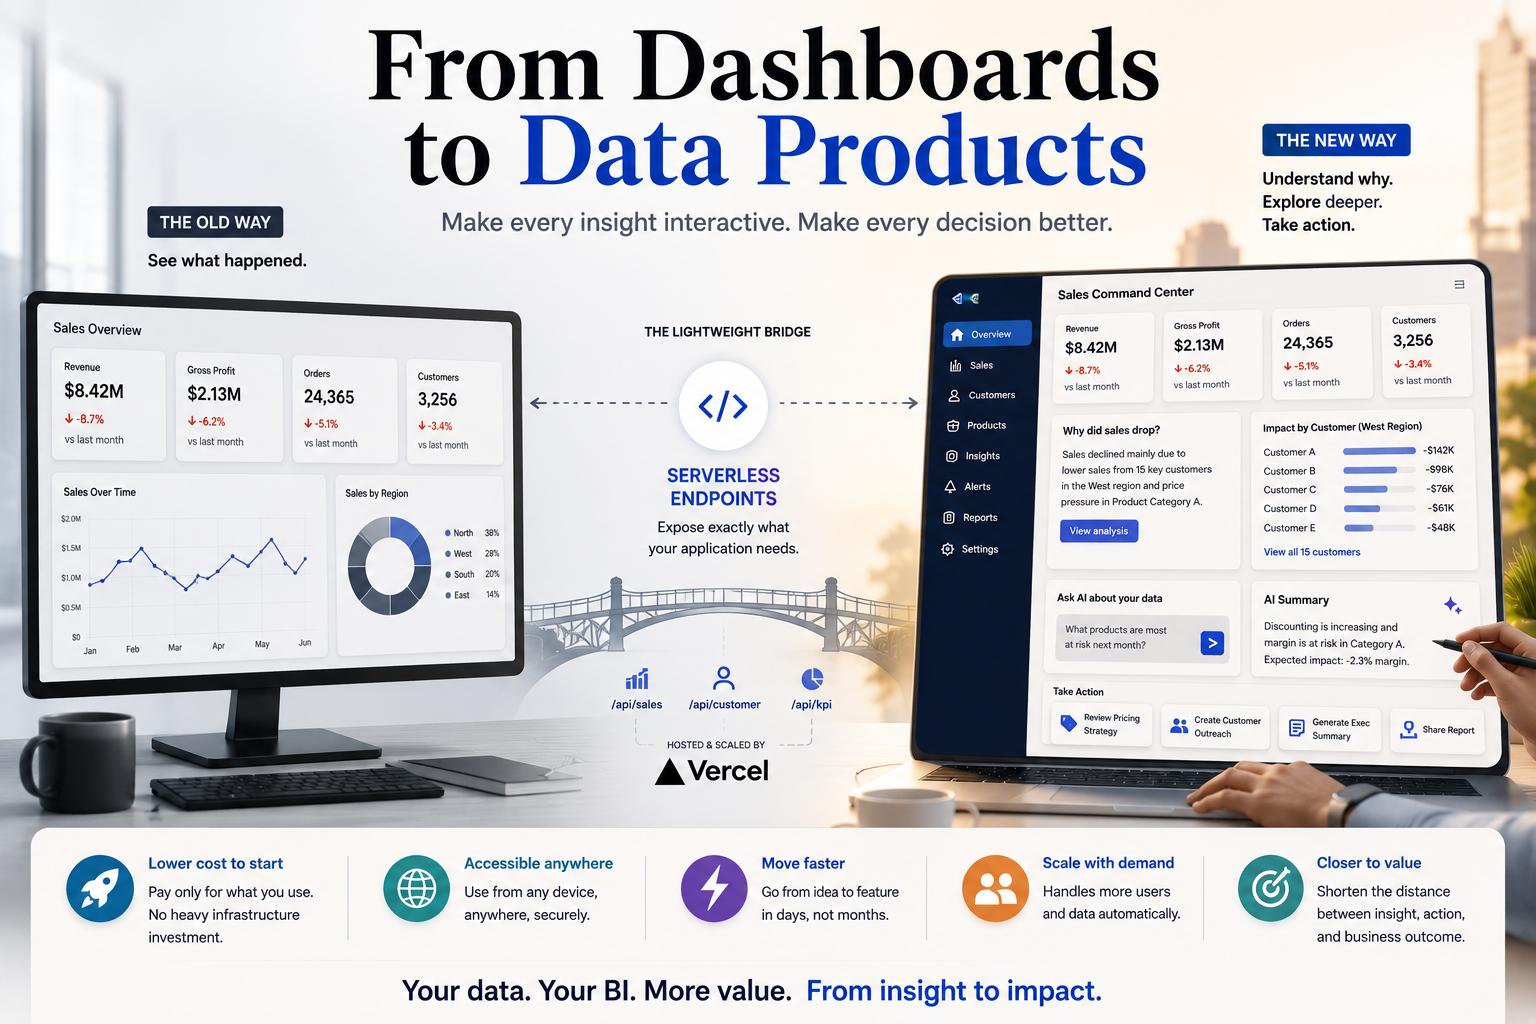
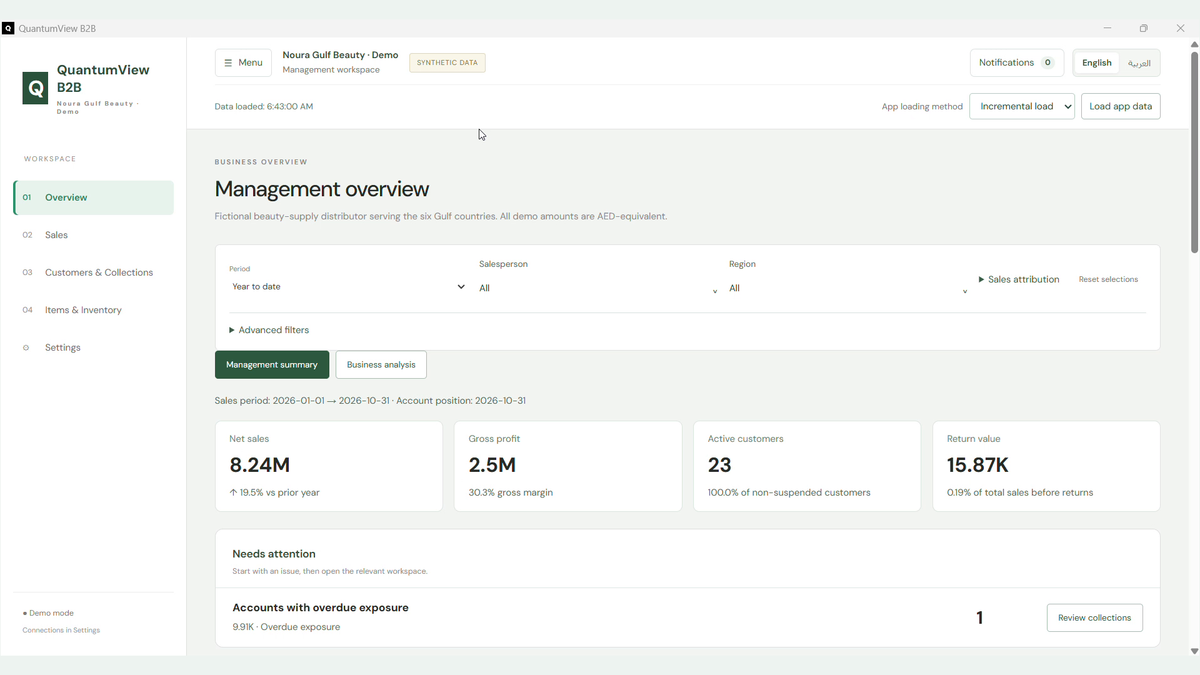
I approached the product around management journeys rather than isolated dashboards. The overview acts as a decision starting point, attention conditions surface supported exceptions, and each area allows the user to continue into customer, item, order, cheque, invoice or salesperson evidence without losing the analytical context.
The design keeps analytical meaning explicit. Sales attribution can distinguish historical transaction ownership from current account responsibility, customer credit remains a whole-account position, stock calculations use their own relevant dimensions, and estimates such as FIFO unpaid invoices or inventory aging are labelled according to the evidence available.
The implemented application combines an overview, sales analysis, customer and collections workspaces, item and inventory analysis, orders and availability, salesperson profiles, detailed reports and export workflows. It supports configurable company profiles, full and incremental imports into a compatible QuantumView destination, explicit analytical loading and bilingual English and Arabic presentation.
Analytical capabilities include period and prior-year comparisons, profitability review, customer buying momentum and cadence, receivables and cheque exposure, aging, ABC and FSN inventory classification, stock efficiency, cost analysis, order coverage and evidence drilldown. Optional AI analysis can interpret prepared sales, customer and account evidence when the user explicitly requests it.
Supporting technologies
- SQL Server
- Business Intelligence
- Windows Desktop
- PWA
- AI Analysis
- Excel Export
- PDF Reporting
03
What changed
The supporting product guide documents the implemented Windows and PWA editions, company configuration, controlled import and load workflows, filters and comparisons, management overview, sales and profitability analysis, customer and credit analytics, inventory and order analysis, AI interpretation, reporting, metric definitions, data-quality controls and current operating boundaries.
The guide also documents a fictional Gulf beauty demo used to demonstrate the product without production customer data. This case therefore describes implemented capability and design logic, not an unverified claim about client adoption or measured financial impact.
QuantumView B2B provides a connected path from management-level signals into the operational evidence behind them, bringing several analytical questions that are normally reviewed separately into one controlled environment.
Its practical value is not that it replaces the ERP or automates operational decisions. It gives management a more coherent way to investigate sales, customer exposure, inventory, orders and profitability while keeping the underlying business rules and evidence boundaries visible.